 ☰
🔍
☰
🔍
 ☰
🔍
☰
🔍
23 10月 2015
Posted by Damien Mabin, Developer Advocate
More and more mobile games base their economic model on virtual currencies and free to play, yet there are plenty of pitfalls to be aware of while developing your game. One of these pitfalls is having an unbalanced economy. Sources and Sinks, a handy feature included in the Play Games Services toolset, is specifically designed to help measure the balance of your game’s virtual economy.
It helps you visualise in one simple diagram the state of your current in game economy. In diagram 1 (below), along the x-axis (time), and y-axis (amount of virtual currency), we see 2 curves:
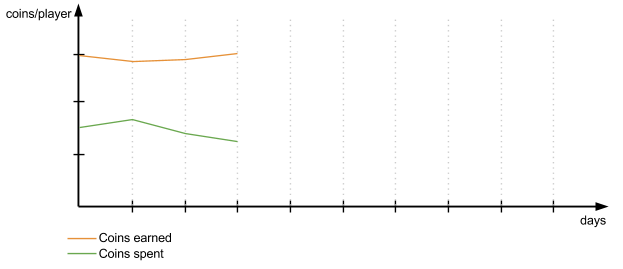
What do the curves in the diagram tell us? In this case, that our game is likely not going to monetize well. Users are spending less currency than they are earning: resulting in a surplus. There is no sense of scarcity for the user which may indicate that your players do not understand how they can spend currency or that there is value to them in doing so. It would be a good idea in this case to re-evaluate how much content is available to spend virtual currency on and how discoverable this content is to your users. Alternatively, you may want to consider decreasing the amount of in game earned currency is available (inflation can be a bad thing). Ultimately, you want your curves to change as demonstrated in diagram 2 (below).

That’s a lot better! Now your users are spending more than they earn… Wait! How is that possible? Two reasons: Players are spending the stock of money they accumulated before your changes. Moreover, there is another important point not to forget: you should not track in the above diagrams the amount of virtual currency the user purchase through in app purchases. If you wait a few more days, you should see the 2 curves converge a bit; the delta of them being the amount of virtual currency users purchase through IAP:

With play game services you can get this visualisation with 2 lines of codes! It works on iOS and Android and doesn’t require the user to sign in to Play Games. What you will have in your Android or iOS app is something like this:

You can find more information about the integration here.
Once the client integration done you can go into your Play Store Developer Console to visualise the curve. Go into the “Game services” section, and click on “Player analytics->overview.”
Android Developers


 Google Play


