 ☰
🔍
☰
🔍
 ☰
🔍
☰
🔍
08 Mayıs 2019
Posted by Jamal Eason, Product Manager, Android

Android Studio 3.5 Beta is ready to download today. Last year, at Google I/O, we heard from many of you that you wanted us to focus even more on quality and stability over features. Consequently, we kicked off Project Marble, focused on making the fundamental features and flows of the Integrated Development Environment (IDE) rock-solid. Android Studio 3.5 is the culmination of this effort. The results of Project Marble are focused on three core areas: system health, feature polish, and bugs. We are seeking your final round of feedback to make sure we didn't miss a key area that matters to you, so download Android Studio 3.5 on the beta channel today to let us know what you think.
Many times it can be difficult to see the range of changes that go into a quality release. Therefore, this post and our Google I/O talk on What’s New in Android Development Tools walk through a variety of changes in each of the major focus areas of Project Marble within Android Studio 3.5. We are certainly not done improving quality with Android Studio, but with the work and new infrastructure put into Project Marble for long term quality tracking we hope that you are even more productive in developing Android apps.
What's New in Android Development Tools (Google I/O'19)
System Health - Memory
One of the major points of feedback on Android Studio is how slow the IDE runs over time. Many times the reason behind this experience is due to unexpectedly reaching memory pressure or IDE memory leaks. We dug into this area, and as part of Project Marble, we have addressed over 33 impactful memory leaks. To identify leaks, we now measure out-of-memory exceptions on an internal dashboard on an on-going basis for those who opt-in to share data with us which enables us to focus and fix the most impactful issues. Starting with Android Studio 3.5, when the IDE runs out of memory, we capture some high level statistics about the size of the memory heap and dominant objects in the heap. With this data the IDE can do two things: suggest better memory settings and offer to do a deeper memory analysis.

Memory Settings

Memory Usage Report
System Health - Exceptions
We have revamped our exception process backend pipeline. Now with the opt-in data we have earlier signals of common exceptions in aggregate which lets us prioritize and fix issues earlier in the canary release process than before. Moreover, we reduced the amount of times we prompt you for exceptions, since the analytics and opt-in crash reports are now more actionable for our team. The net result is that you should see the blinky red exception report icon in the lower status bar of the IDE less frequently.

Android Studio Exception Bubble
System Health - User Interface Freezes
User Interface (UI) freezes are another common issue we heard from you. In Android Studio 3.5, we extended the infrastructure of the underlying Intellij platform, and now measure UI thread stops that last longer than a few moments. Over time, we will have a bigger picture of the top hit spots to focus our efforts on. For example, during the Project Marble development, we found in our data that XML code editing was notably slower in the IDE. With this data point, we optimized XML typing, and have measurably better performance in Android Studio 3.5. You can see below that editing data binding expressions in XML is faster due to typing latency improvements.


Code Editing Before - Android Studio 3.4 (left) and Code Editing After - Android Studio 3.5 (right)
System Health - Build Speed
We continued our investment in build speed. For those developers with larger projects, it is the number one concern. As we uncovered in our recent Medium blog post on build speed, many elements can affect build performance, sometimes slowing it down more than we can improve. However, during Project Marble, we made speed improvements by adding incremental build support to the top annotation processors including Glide, AndroidX data binding, Dagger, Realm, and Kotlin (KAPT). Incremental support can make a notable impact on build speed. For example, in our preliminary analysis, adding incremental support just for Kotlin has improved submodule non-ABI code changes for the Google I/O schedule app from 9.1 seconds to 3.6 seconds – a 60% improvement. Read more about the performance changes to the build system here.
System Health - IDE Speed
In the past, a pro-tip some developers used to do is to turn off Android Studio plugins such as Android NDK support to improve performance. While there is nothing wrong with disabling plugins to remove extra menus or options that you don't need, we removed some unnecessary performance hotspots for the Android NDK support that impacted overall IDE speed.
System Health - Lint Code Analysis
Android Lint is a code analysis framework in Android Studio that helps identify common programming mistakes. However, we learned from several user reports that Lint could be too slow—especially when running in batch analysis mode on large projects. After some digging, we found and fixed several large memory leaks, leading to a roughly 2x speedup in Lint performance. We also published a profiling tool that can help identify bottlenecks in individual Lint checks. Read more about the analysis and tool here.
System Health - I/O File Access for Windows
Many users of Android Studio use Microsoft Windows. Over time, we received a range of reports from users on this platform that build times and installation speeds were increasingly getting slower. After investigating the problem during Project Marble, we realized that recent anti-virus programs included Android Studio build and installation directories as active scan targets. Since these folders have many small files created and removed over time, the I/O and CPU are partially taxed and consequently impacts the overall build/sync performance of Android Studio.

Google Internal Data, 2.2GHz quad-core Intel Core i7, April 2019

System Health Notification - Anti-virus Check
System Health - Emulator CPU Usage
Many app developers enjoy the fast and responsive emulator which has had dramatic performance improvements in the last few years. However, we heard from you that the Android Emulator seems to take an inordinate amount of CPU cycles and triggers the cooling fans on laptops even when the emulator is idle in the background. After investigation and measurement, we found that Google Play Services and related services were aggressively running in the background because by default the emulator was set to AC charging instead of battery discharging. We switched the default to battery discharging, and background CPU usage declined by more than 3x. This change is just of the many optimizations we made to the Android Emulator during Project Marble. Learn more about the Android Emulator and Project Marble here.

Google Internal Data on Apple MacBook Pro (15” 2016), Emulator: Pixel 3 API 28
Feature Polish - Apply Changes
Being able to quickly edit and see code changes you have made without restarting your app is great for app development. Two years ago, the Instant Run feature was our attempt to enable this flow, but it ultimately fell short of expectations. During the Project Marble time period, we re-architectured and implemented from the ground-up a more practical approach in Android Studio 3.5 called Apply Changes. Apply Changes uses platform-specific APIs from Android Oreo and higher to ensure reliable and consistent behavior; unlike Instant Run, Apply Changes does not modify your APK. To support the changes, we re-architected the entire deployment pipeline to improve deployment speed, and also tweaked the run and deployment toolbar buttons for a more streamlined experience. Learn more about the architecture behind Apply Changes here.

Apply Changes Buttons
Feature Polish - Gradle Sync
A recent and annoying pain point in Android Studio is to have your project unexpectedly trigger red symbols across your app code, especially when re-opening your project. The Gradle build system retains a cache of all the dependencies in your home directory that allows the IDE to quickly sync without re-downloading new artifacts. The root cause for many of the recent incidents of red symbols appearing is that in a recent Gradle change, these caches were periodically deleted to save hard drive space. The IDE was unaware of the discrepancy and consequently generated red symbols for missing dependencies. Starting with Android Studio 3.5, we now have the conditional logic to check for this state. We certainly have more we can do in this area, but this is just one example of the types of issues we addressed for project sync during Project Marble.
Feature Polish - Project Upgrades
Ideally, the Android Studio team would like you to be on the latest version of the IDE since this is where the team does active feature development, bug fixing and performance improvements. We know that upgrading your Android Studio is not a seamless process as it should be with many issues revolving around fixing gradle plugin errors. With Android Studio 3.5, we have updated the user experience on output windows, pop-ups and dialog boxes to help clarify when you actually need to upgrade, plus we made more sync & build upgrade errors more actionable.
From a recent developer survey, we heard that many developers upgrade the Android Studio IDE and the Gradle plugin at the same time. As of the last several releases, the IDE and your gradle plugin can actually be updated independently. This means if you want the latest build system speed and correctness improvements, you can upgrade your Gradle plugin, but you can also wait until you're ready. Whether or not you upgrade you Gradle plugin at the same time as the IDE, we encourage you to be on the latest release of Android Studio 3.5 to start using all the enhancements from Project Marble.
Feature Polish - Layout Editor
Based on user research on the layout editor and input from you, we know that there are several performance and error-prone usability issues that make editing XML the only path forward, especially when working with ConstraintLayout. To address the general usability of the layout editor, we refined a wide range of interactions from constraint selection and deletion, to better device preview resizing. While XML code editing is still a click away, we hope you can see that these interaction refinements can be a big productivity boost when creating and editing layouts in Android Studio. Learn more about the full range of layout editor changes here.


Layout Editor Before - Android Studio 3.4 (left) and Layout Editor After - Android Studio 3.5 (right)
Feature Polish - Data Binding
During Project Marble, we also took a look at long standing issues with data binding. From a performance perspective, we found that creating data binding expressions in XML files would lead to severe hangs in the code editor. After fixing this issue we also improved code completion, navigation, and refactoring.
Feature Polish - App Deployment Flow
We streamlined the deployment flow during Project Marble, by adding a new dropdown to easily see and change the device you intend to deploy to and a new menu item to deploy to multiple devices.

App Deployment User Flow
Feature Polish - C++ Improvements
C++ project support was also a focus area during Project Marble. CMake builds are now up to 25% faster for large projects because the IDE now invokes parallel Ninja targets. Additionally, you will find an improved single build variant user interface panel that allows you to specify ABI targets separately.. And lastly, Android Studio 3.5 allows you to use multiple versions of the Android NDK side-by-side in your build.gradle file. This should allow you to have more reproducible builds and mitigate incompatibilities between NDK versions and the Android gradle plugin.

Single Variant Selection by ABI
Feature Polish - Intellij Platform Update
This release of the Android Studio includes the features and quality enhancements of the 2019.1 Intellij platform release. The 2019.1 Intellij updates has a range of improvements from custom themes to better version control system integration.
Feature Polish - Conditional Delivery for Dynamic Feature Support
Android Studio 3.5 enhances app bundle feature support with the addition of conditional delivery features for your app bundle. Conditional delivery allows you to set certain device configuration requirements for dynamic feature modules to be downloaded automatically during app install. You can set conditional delivery based on hardware features such as OpenGL versions, support for Augmented Reality, or you set conditions based on API level and user country.

Module Selection for Conditional Delivery
Feature Polish - Emulator Foldables & Pixel Device Support
This release of the IDE includes the Android Emulator skins for Pixel 3a and Pixel 3a XL. Additionally, the Android Studio supports the creation of foldable Android Virtual Devices.

Android Emulator - Foldable Support
Feature Polish - Chrome OS Support
Android Studio 3.5 is now officially supported on Chrome OS 75 and higher on high-end x86 based Chromebooks. During Project Marble we refined a few usability issues, and now have an installer for Android Studio and support app deployment to external USB connected Android devices. Learn more how to setup the IDE on Chrome OS here.
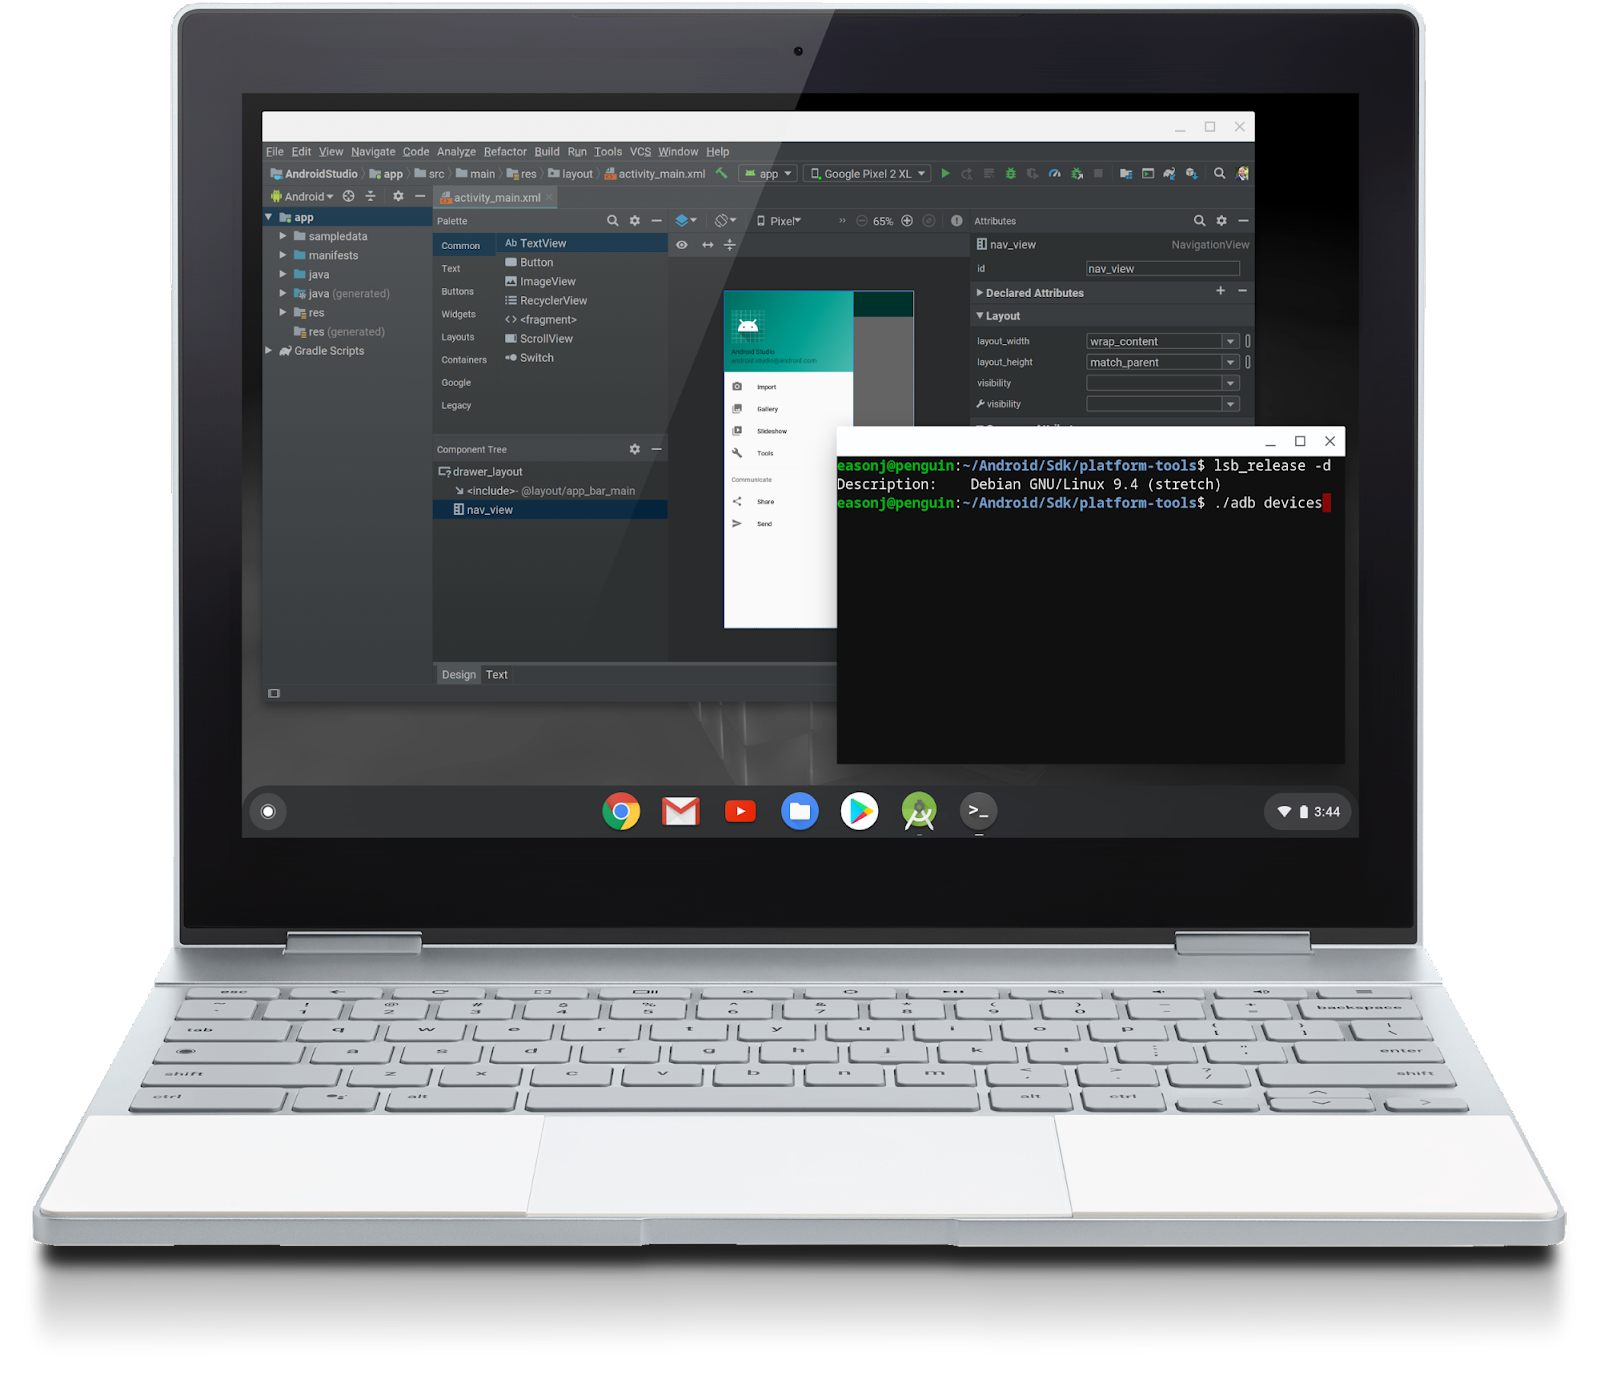
Android Studio on Chrome OS
To recap, Android Studio 3.5 has hundreds of bug fixes and notable changes in these core areas:
System Health
Feature Polish
Check our the Android Studio preview release notes page for more details and read about deep dives into several areas of Project Marble in the following Medium blog posts:
Opt-In & Feedback
The specific areas and the approach we took to optimize Android Studio for Project Marble were all based on your feedback and metrics data. The aggregate metrics you can opt-in to inside of Android Studio allow us to figure out if there are broader problems in the product for all users, and the data also allows the team to prioritize feature work appropriately. There are are a couple pathways to help us build better insights. At a baseline, you can opt-in to metrics, by going to Preferences /Settings → Appearance & Behavior → Data Sharing.

IDE Data Sharing
Additionally, throughout the year, you might see user sentiment emojis in the bottom corner of the IDE. Those icons are a lightweight way to inform the Android Studio team on how things are going and to give us in-context feedback, and the fastest way to log a bug and send to the team.

IDE User Feedback
Getting Started
Download
Download the beta version of Android Studio 3.5 from the download page. If you are using a previous release of Android Studio, you can simply update to the latest version of Android Studio. If you want to maintain a stable version of Android Studio, you can run the stable release version and beta release versions of Android Studio at the same time. Learn more.
To use the mentioned Android Emulator features make sure you are running at least Android Emulator v29.0.6 downloaded via the Android Studio SDK Manager.
As mentioned above, we appreciate any feedback on things you like, and issues or features you would like to see. If you find a bug or issue, feel free to file an issue. Follow us -- the Android Studio development team ‐ on Twitter and on Medium.
Android Developers


 Google Play


