The Android Studio team has been abuzz with the stable release of Android Studio Bumblebee (2021.1.1) 🐝 and Android Gradle plugin (AGP) 7.1.0; the latest versions of Android official IDE and build system. We’ve improved functionality across a broad area of the typical developer workflow: Build and Deploy, Profiling and Inspection, and Design.
Some notable additions include a unified test execution between Android Studio and your continuous integration (CI) server ✅, convenient pairing flows to support ADB over Wi-Fi 📲, Improved Profiler tools to help you identify and analyze jank in your app 🕵️, and new ways to preview animations 🎥 and UI interactions without deploying your app to a device.
As always, this release wouldn’t be possible without the early feedback from our Preview users. So read on or watch below for further highlights and new features you can find in this stable version. If you’re ready to jump in and see for yourself, head over to the official website to download Android Studio Bumblebee (2021.1.1).
What’s in Android Studio Bumblebee (2021.1.1)
Below is a full list of new features in Android Studio Bumblebee (2021.1.1), organized by the three major themes.
Build and Deploy
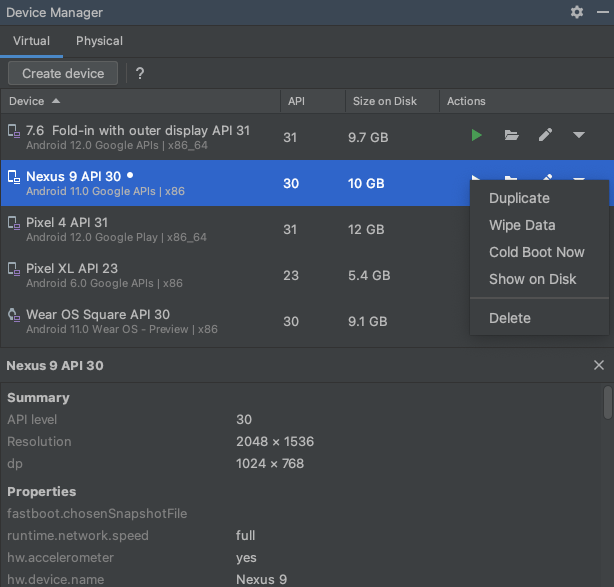
New Device Manager: This new tool window in Bumblebee makes it easier to see and manage your virtual and physical test devices, and you can open it by selecting View > Tool Windows > Device Manager from the main menu bar. In the Virtual tab, create a new device, review device details, delete a device, or anything else you used to do from the now removed AVD Manager. In the Physical tab, quickly pair to a new device using ADB Wi-Fi and see details of each physical device at a glance, or quickly inspect each device’s file system using the Device File Explorer with a click of a button. Learn more about the New Device Manager in the release notes.
Device Manager
ADB over Wi-Fi: Bumblebee includes a simplified flow to connect to your Android 11 and higher devices over Wi-Fi for deployment and debugging using ADB. After you enable debugging over Wi-Fi on your device, select the Pair using Wi-Fi action in the Physical tab of the new Device Manager to open the pairing wizard. Then follow the steps provided to pair to a device connected over the same network. Learn more.
Pairing a device with ADB over Wifi
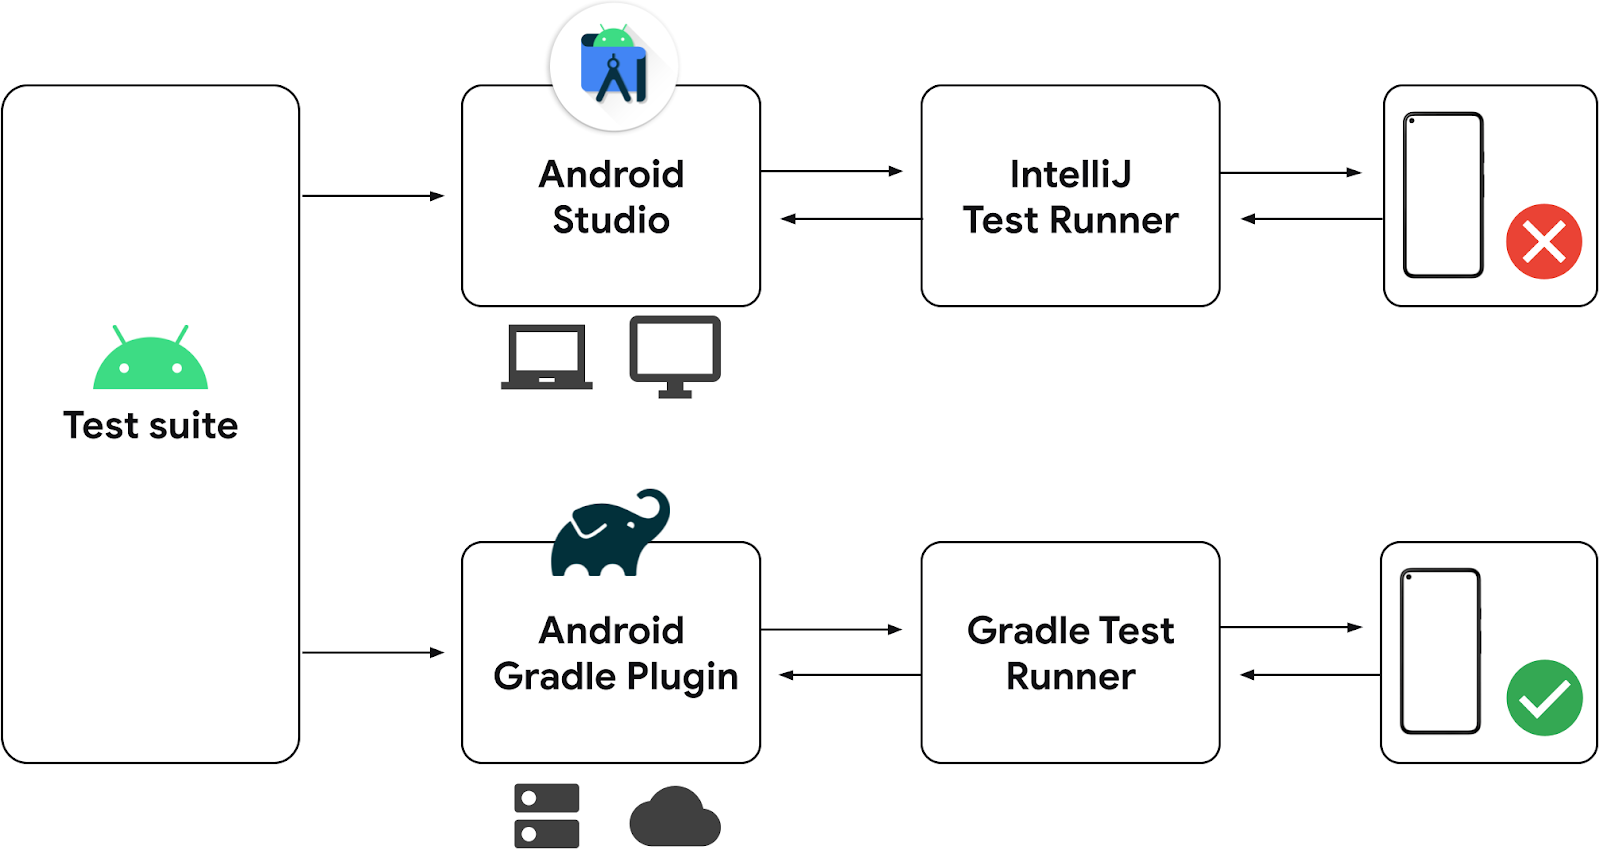
Run Instrumented Tests in Android Studio using Gradle: Have you ever run tests in Android Studio with different results than the same tests running on your CI? This can be a frustrating issue that leads to lost productivity. To resolve this issue, we’ve introduced a new test runner to Android Gradle plugin (AGP) 7.1.0 that Android Studio Bumblebee uses by default when running instrumentation tests, so all your tests run through a unified test runner. This is a similar improvement to Android Studio Arctic Fox, where we started running all unit tests via Gradle by default. And, similarly, this improvement doesn’t require you to change how you write or run your tests!
Using different runners lead to inconsistent results
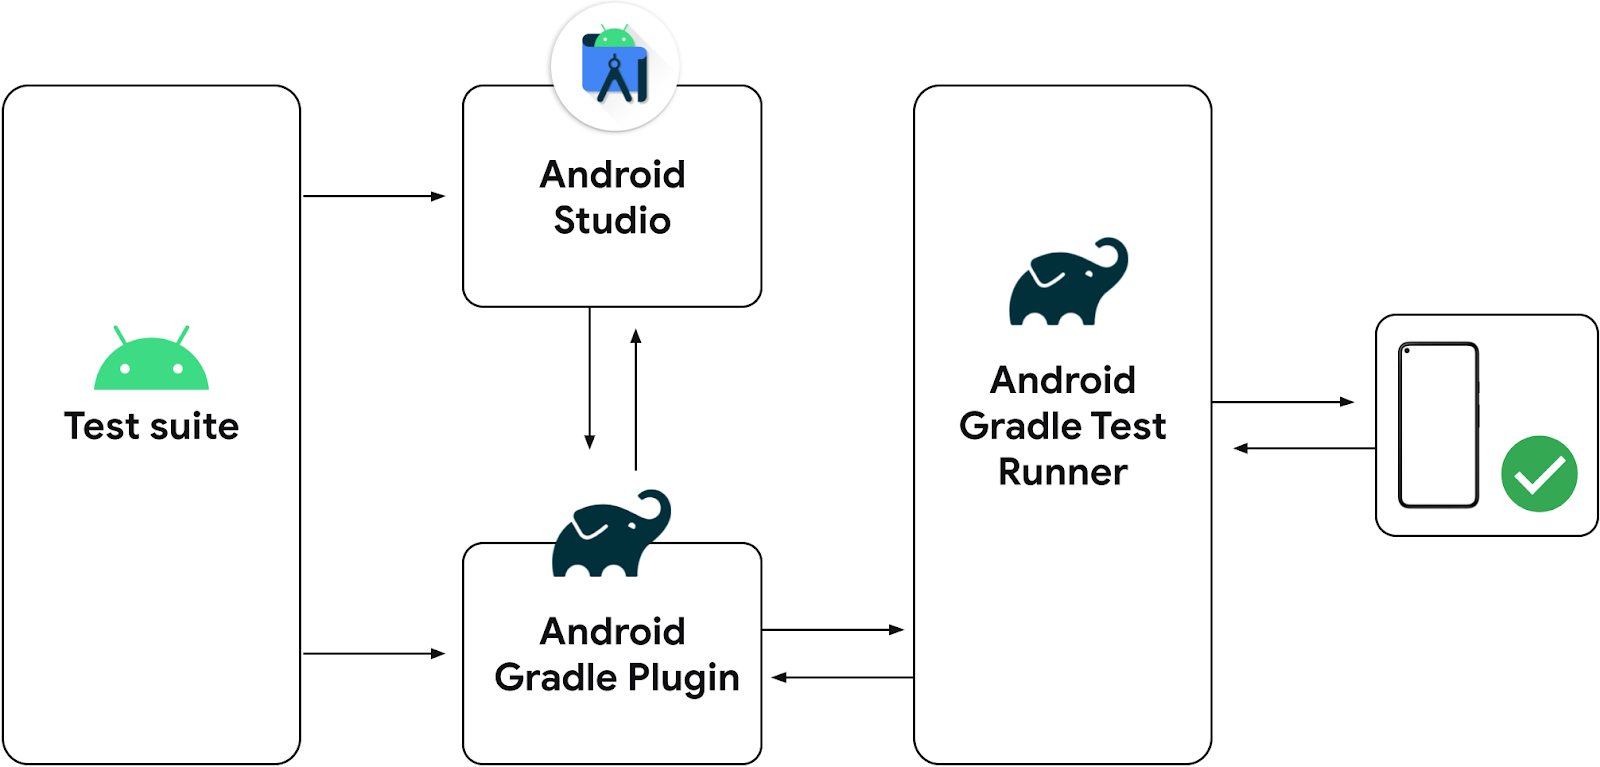
Android Studio now runs instrumentation tests via Gradle
Android Gradle Plugin Upgrade Assistant now updates API usage: Originally introduced in Android Studio 4.2, the AGP Upgrade Assistant helped users update their projects to the latest version, and improvements in Arctic Fox provided a new UI with the ability to review and select the upgrade version and steps. In Bumblebee, the Upgrade Assistant now also checks for and offers to update your DSL to help you avoid using deprecated APIs before they are deleted. For more information see the Android Gradle Plugin DSL/API migration timeline.
Non-Transitive R classes on for new projects: Android Studio Arctic Fox introduced new refactoring tools to help you use non-transitive R classes to enable faster builds for applications with multiple modules. When creating new projects using Bumblebee, the IDE configures your project to use non-transitive R classes, by default. While this does bring performance improvements, you now have to refer to R classes by their proper package name, and not by the package names of their parent modules, as they will no longer resolve transitively. For more information see Use non-transitive R classes.
Emulator tool window enabled by default: Introduced in Android Studio 4.1, the Emulator launches within an Android Studio tool window and allows you to deploy and interact with virtual Android devices while fully remaining within the context of the IDE. The changes ads an improved UX for extended controls and snapshot management. For more information see Run the Android Emulator directly in Android Studio.
Apple Silicon Support Update - For those using macOS on Apple Silicon (arm64) hardware, Android Studio Arctic Fox and the Android Emulator have supported this new architecture since last year. However, with this release, we have now updated the Android SDK platform tools v32.0.0 (which includes ADB and fastboot) and build tools v32.1.0 (which includes aapt) to be universal binaries so that your Android developer tools no longer need the Rosetta binary translator to run. Based on community feedback, those developers on this hardware platform have seen notable performance improvements. See release notes.
Profile and Inspect
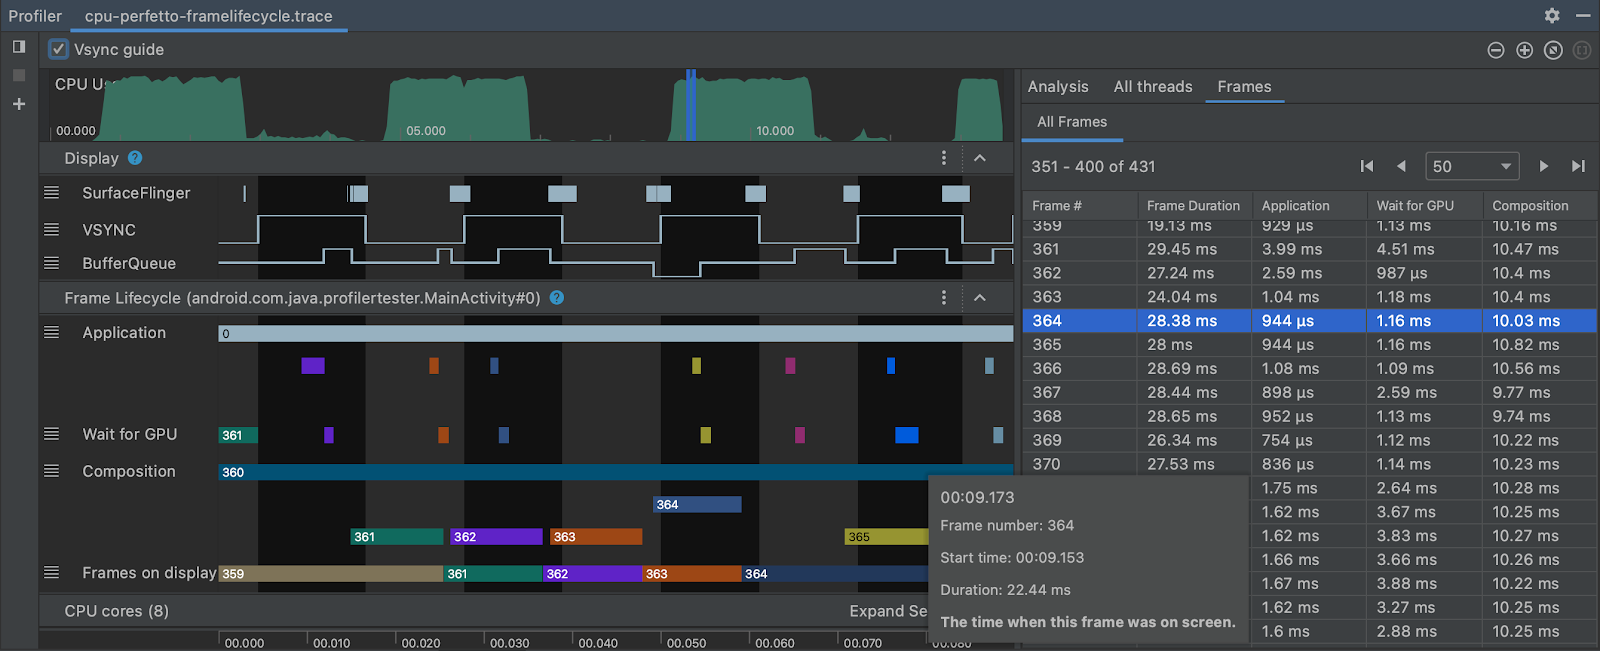
Jank detection track in Profilers: When profiling your app using devices running Android 11 (API level 30) or higher, the CPU profiler now shows a new group of tracks that illustrate the stages of each frame under Frame Lifecycle: Application, Wait for GPU, Composition and Frames on display. Each track labels the frames with a frame number and color-codes the rectangle to make it easy for you to visualize where a particular frame is in its lifecycle, along with guides you can toggle to compare with Vsync events. You can use this data to understand where Jank might occur in your app and investigate the root causes. In the Analysis panel, there is now a Frames tab, which conveniently summarizes rendering information for all frames. For more information, see UI jank detection.
Detailed frame lifecycle information in the CPU Profiler
Profileable app profiling support in Studio Profilers: When profiling your app, it’s important to generate accurate data with the version of your app that most closely resembles what your users will install. To do so, you can now include the <profileable> property in your app’s manifest to profile apps that are not debuggable, as shown below.
<profileable android:shell="true"/>
Profileable is a manifest configuration introduced in Android 10, and is available for CPU and Memory profiling tasks. Using the profileable flag instead of the debuggable flag has the key advantage of lower overhead for performance measurement; however, certain profiling features are not available for Profileable builds, such as the Event timeline, API initiated CPU profiling, heap dumps, or live location recordings. For more information, see Profileable applications.
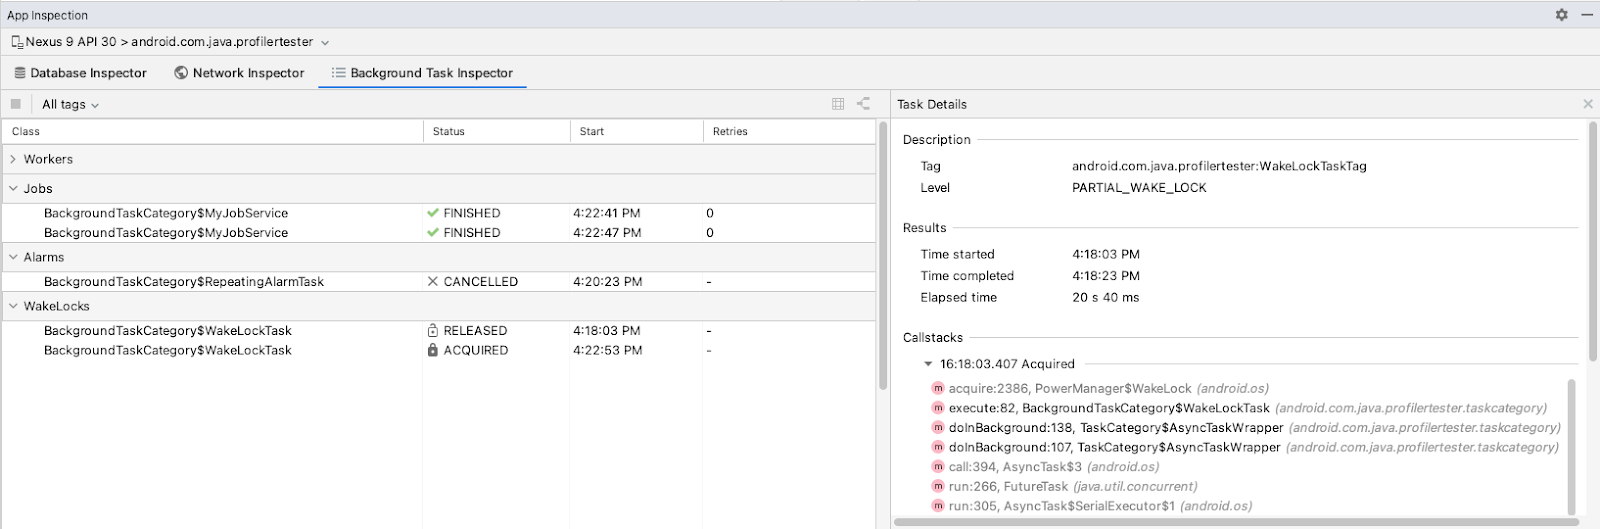
Inspect Jobs, Alarms, and Wakelocks: The Background Task Inspector has been expanded to allow you to inspect Jobs, Alarms, and Wakelocks. You can see live information on how these background tasks are being scheduled, and see detailed information about their execution, similar to how you can inspect Workers. Additionally, when inspecting Workers, you can track and inspect Jobs that your Workers schedule for you. If you used to use the Energy Profiler in previous versions of the IDE, you should now navigate to View > Tool Windows > App Inspection from the menu bar and select the Background Task Inspector to inspect Jobs, Alarms, and Wakelocks.
Inspect Jobs, Alarms, and Wakelocks in the Background Task Inspector
Network Inspection: The Network Profiler has now migrated to the App Inspection tool window, to allow for a lighter-weight experience for inspecting network traffic in your app. The look and feel of the Network Profiler has been maintained and works with any debuggable app on devices running API level 26 and higher. To use the new inspector, select View > Tool Windows > App Inspection from the menu bar and select the Network Inspector. For more information, see Inspect network traffic with the Network Inspector.
Capture Layout Inspector snapshots: You can now capture snapshots of your app’s layout hierarchy to save, share, or inspect later. Snapshots capture the data you would typically see when using the Layout Inspector, including a detailed 3D rendering of your layout, the component tree of your View, Compose, or hybrid layout, and detailed attributes for each component of your UI. When inspecting the layout of a live running app, click Export snapshot from the Layout Inspector toolbar and save the snapshot with an *.li extension. You can then load a Layout Inspector snapshot by selecting File > Open from the main menu bar, and opening a *.li file. The snapshot appears in a tab in the Editor window, so that you can easily compare it with your running app. Learn more at Capture layout hierarchy snapshots.
Support for Compose semantics in the Layout Inspector: In Compose, Semantics describe your UI in an alternative manner that is understandable for Accessibility services and for the Testing framework. In Android Studio Bumblebee, you can now use the Layout Inspector to inspect semantic information in your Compose layouts. When selecting a Compose node, use the Attributes window to check whether it declares semantic information directly, merges semantics from its children, or both. To quickly identify which nodes include semantics, either declared or merged, use select the View options dropdown in the Component Tree window and select Highlight Semantics Layers.
Design
Interactive Preview: Android Studio Arctic Fox launched with support to statically preview your composable functions in the Design / Split window of the Editor. In Bumblebee, we’ve expanded functionality to allow you to interact with certain components of your Compose layouts, to validate behavior without building and deploying the full app to a running device! To get started, navigate to a previewable compose function and click Start Interactive Mode in the Design / Split window. For more information see Interactive mode.
Interact with the Compose Preview to validate behavior
Animated Vector Drawables Preview: The Preview window is now also available when viewing vector drawables. When viewing a static drawable, you can use the preview window to change background options between “None”, “White”, “Black”, “Checkedered”, to view your drawable against different conditions. Animated drawables also provide the option to preview the animation at different speeds as well as backgrounds, to help you test animations before using them in your app. To learn more, see Animated Vector Drawables (AVD) preview.
Preview your animated vector drawables
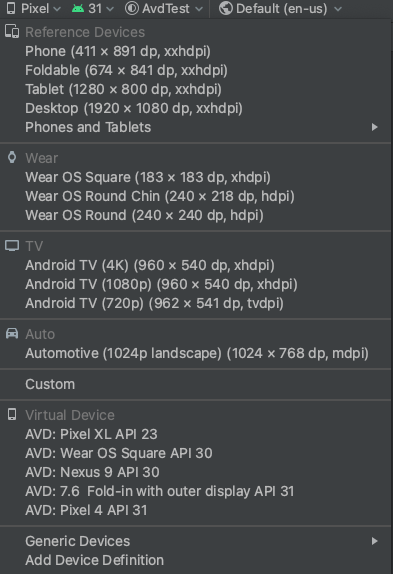
Updated Device picker for design tools: To simplify designing your app for the diverse number of Android devices, we’ve updated the device picker in various design tool windows, such as Layout Editor and Layout Validation, with reference devices that reflect popular sizes of each device form factor. From phones to tablets, and Wear devices to Android TVs, it’s now easier to preview, validate, or edit your layout on screen sizes that are most representative of popular real-world devices. To learn more, see Change the preview appearance.
To recap, Android Studio Bumblebee (2021.1.1) includes these new enhancements & features:
Build and Deploy
Run Instrumented Tests in Android Studio using Gradle
Android Gradle Plugin Upgrade Assistant now updates API usage
Non-Transitive R classes on for new projects
New Device Manager
ADB over Wi-Fi
Emulator tool window enabled by default
Apple Silicon Support Update
Profile and Inspect
Jank detection track in Profilers
Profileable app profiling support in Studio Profilers
Inspect Jobs, Alarms, and Wakelocks in the Background task Inspector
Capture Layout Inspector snapshots
Support for Compose semantics in the Layout Inspector
 ☰
🔍
☰
🔍


 Google Play


