 ☰
🔍
☰
🔍
03 November 2022

The debug build allows you to use features useful for development, like Apply Changes, working with the debugger, or the Database Inspector. In addition, it also enables profiling tools to inspect the state of a running app unavailable to the release build.
Under the hood, the debug build sets the debuggable flag in the Android Manifest to true.
AndroidManifest.xml
<application android:debuggable="true"> ... </application> |
.gif) |
To address that issue, the Android platform introduced a tag called profileable. It enables many profiling tools that measure timing information, without the performance overhead of the debug build. Profileable is available on devices running Android 10 or higher.
AndroidManifest.xml
<application> |
Let’s look at another screen recording. This time, the left side shows a profileable release app and the right side an unmodified release app. There’s little performance difference between the two.
 |
With profileable, you can now measure the timing information much more accurately than the debug build.
This feature is designed to be used in production where app security is paramount. Therefore we decided to only support profiling features such as Callstack Sampling and System Trace, where timing measurement is critical. The Memory Profiler only supports Native Memory Profiling. The Energy Profiler and Event Timeline are not available. The complete list of disabled features can be found here. All these restrictions are put in place to keep your app's data safe.
Now that you know what the profileable tag does, let me show you how to use it. There are two options: automatically and manually.
With Android Studio Flamingo and Android Gradle Plugin 8.0, all you need to do is just select this option from the Profile dropdown menu in the Run toolbar: “Profile with low overhead”. Then Android Studio will automatically build a profileable app of your current build type and attach the profiler. It works for any build type, but we highly recommend you to profile a release build, which is what your users see.
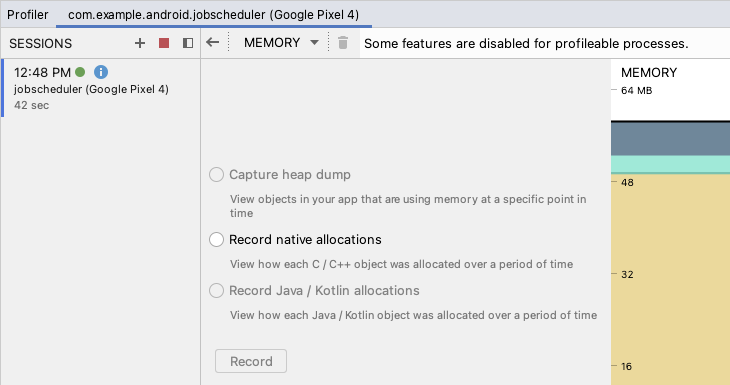
 When a profileable app is being profiled, there is a visual indicator along with a banner message. Only the CPU and Memory profilers are available.
In the Memory Profiler, only the native allocation recording feature is available due to security reasons. |
 |
This feature is great for simplifying the process of local profiling but it only applies when you profile with Android Studio. Therefore, it can still be beneficial to manually configure your app in case you want to diagnose performance issues in production or if you’re not ready to use the latest version of Android Studio or Android Gradle plugin yet.
It takes 4 steps to manually enable profileable.
1. Add this line to your AndroidManifest.xml.
AndroidManifest.xml
<application> |
2. Switch to the release build type (or any build type that’s not debuggable).
 |
3. Make sure you have a signing key configured. To prevent compromising your release signing key, you can temporarily use your debug signing key, or configure a new key just for profiling.
4. Build and run the app on a device running Android 10 or higher. You now have a profileable app. You can then attach the Android Studio profiler by launching the Profiler tool window and selecting the app process from the dropdown list.
In fact, many first-party Google apps such as Google Maps ship their app to the Play Store as profileable apps.
 |
Here’s a table that shows which build type should be used:
| Release | Profileable Release | Debug |
| Production | Profiling CPU timing | Debugger, Inspectors, etc. Profiling memory, energy, etc. |
To learn more about profilable builds, start by reading the documentation and the the user guide.
With these tools provided by the Android team, we hope you can make your app run faster and smoother.